Streaming has changed how we consume entertainment and information. It’s fast, easy, and convenient.
We can access our favorite shows, movies, and music from anywhere, at any time. This flexibility has made streaming a popular choice.
Streaming plays a vital role in today’s dynamic environments, shaping the way we live, work, and interact.
With that said, we have collected some important streaming statistics for 2024. Let’s take a look…
2024 Streaming Stats
27% of Gen Zers, 34% of millennials, 38% of Gen Xers, and 54% of baby boomers watch linear TV daily, indicating a decline in traditional TV viewing, with older generations maintaining its popularity.
Global consumers watch an average of 17 hours of online video weekly, showing an annual increase in weekly online video consumption.
92% of internet users watch digital videos weekly, and 27% watch live streaming content weekly, showing the growing popularity of online video consumption.
Live streams rank as highly engaging social media content, with 37% of consumers rating it top, trailing behind short-form video at 66% and images at 61%.
72% of daily traditional TV viewers identify as sports fans, suggesting live sports may be a key reason they haven’t switched to streaming alternatives.
Overall, live video performs well on Facebook, with people spending 3x more time viewing live videos compared to those no longer live.
The games live streaming market is expected to reach 1.7 billion users, popular among content creators in gaming and esports.
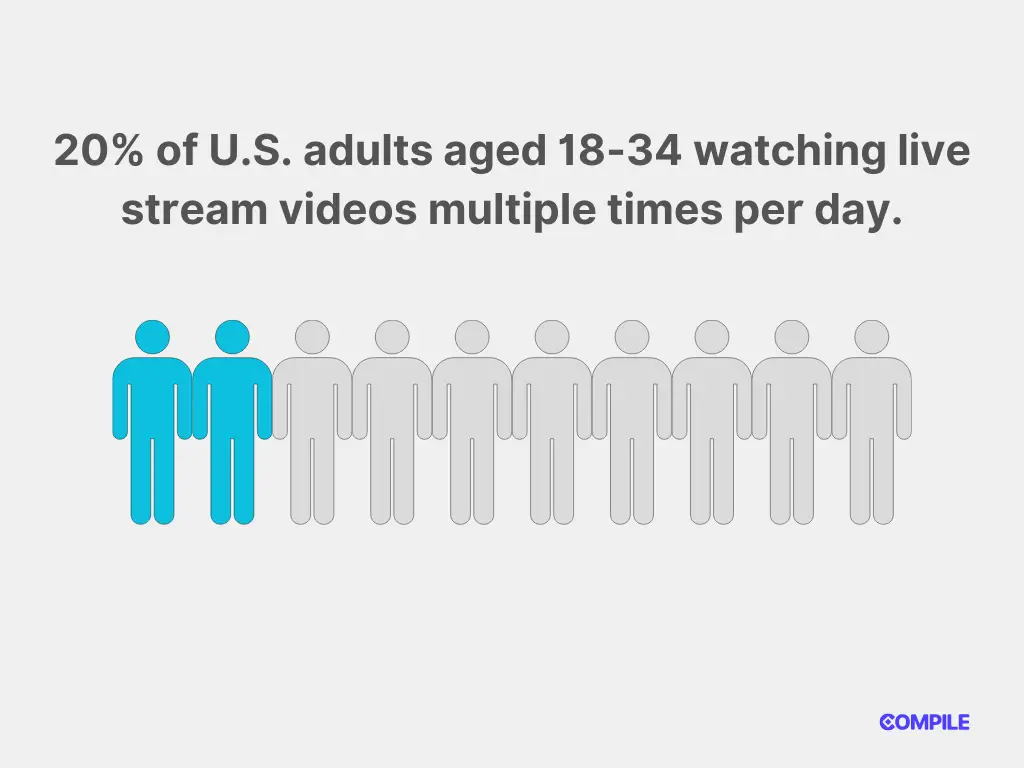
Streaming videos have become a daily habit, with 20% of U.S. adults aged 18-34 watching live stream videos multiple times per day.
Users watch live videos 10-20 times longer than they do pre-recorded, on-demand content.
Among those who report watching live streams, 70% tune in to a live stream daily.
24% of U.S. adults aged 35-54 and 47% of those aged 55+ never watch live stream videos, showing online video is less popular among older internet users.
The 2019 Coachella event holds the record for the highest live viewership, with approximately 82.9 million live views.
The value of the live streaming industry is expected to reach 184.27 billion USD.
Millennials form the largest consumer group for live content, with 63% of those aged 18-34 regularly watching live-streaming content.
750 million users in China, making it a major live streaming hub, with two-thirds of Chinese internet users having watched live streams on smartphones.
Professionals predict that 82% of internet use will be dedicated to streaming video.
42 Mbps is the global average download speed for mobile broadband.
Exclusive coverage is the reason 26% of viewers tune into live streams.
Nearly 25% of households in the United States are expected to cancel their cable subscriptions.
In the U.S., 232 million people have watched streaming or downloaded video on various devices.
90% of individuals use the internet to watch videos.
Live stream quality is improving quickly, with better buffering and video start times than on-demand video.
Latency will be reduced by 10 times with 5G.
On mobile, individuals spend an average of 16 minutes daily watching videos.
29% of consumers are willing to pay extra for 5G if it improves video quality and reduces buffering on mobile devices.
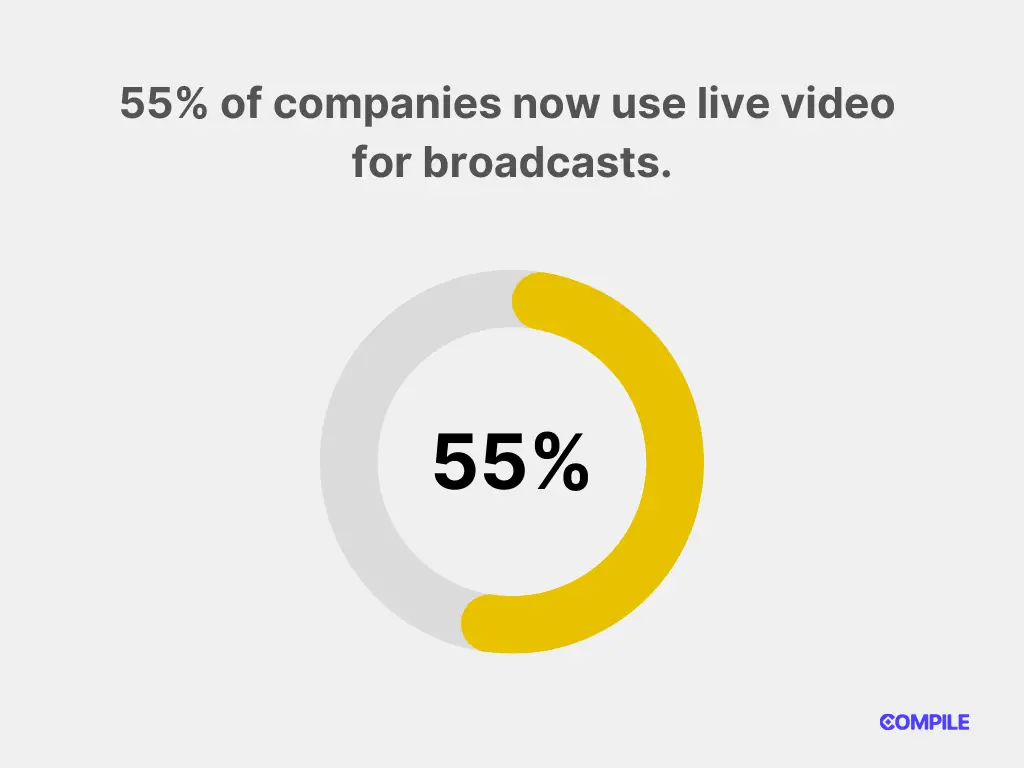
55% of companies now use live video for broadcasts across their company or divisions.
Live streams experience a starting failure rate of 2.6%, making it the most significant quality issue for live video.
65% of enterprises surveyed reported live-streaming to multiple locations.
About 25% of marketers report live streaming as the top tool for trade show promotion.
77% of employees report experiencing issues such as buffering when streaming live video at work.
Support calls have decreased by 43% due to video content usage by video marketers.
Nearly 3/4 of millennials say videos are useful for comparing products during online shopping.
82% of viewers prefer watching live streams over viewing a brand’s social media posts.
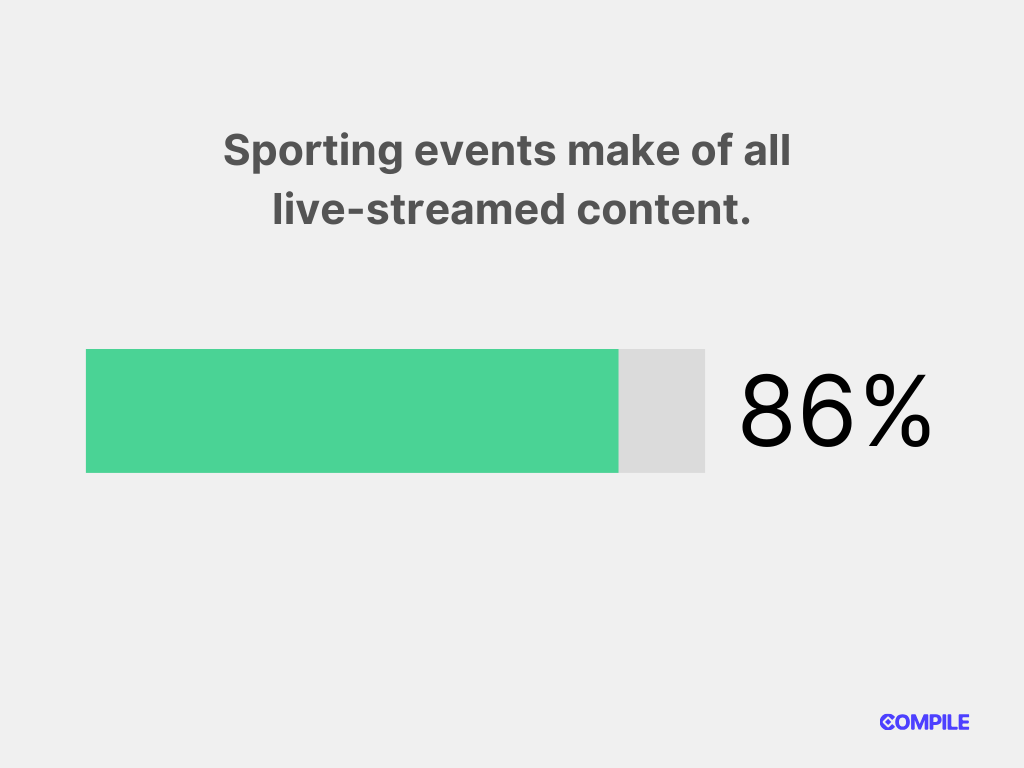
Sporting events make up 86% of all live-streamed content.
Advertising revenue is projected to reach $47 billion, as reported by Digital TV Research.
Over 1/3 of professional broadcasters earn money through subscription models.
70% of marketers claim that video content leads to higher conversion rates than any other type of content.
The annual growth rate of subscription-based video on demand revenue is expected to be 10.7%, reaching a market volume of $85,735 million.
The online video industry loses up to $71 billion annually due to piracy.
The eLearning market is projected to reach a value of $325 billion.
20% of people find new products and brands through social media live streams.
Only 3% of marketers utilize the live streaming function on LinkedIn.
Each month, 28% of Facebook users watch a live stream on the platform.
Instagram’s “Live” feature experienced a 70% growth in usage.

Nearly 25% of viewers report they will continue to stream more post-COVID-19.
Live stream watch time has seen a 250% increase.
During the lockdown, 44% of Brazilians used smart TVs and streaming services to watch video content.
Around 548 billion hours were spent by people streaming through mobile devices.
$184.27 billion is the expected revenue for live video streaming.
Live streaming constitutes 23% of worldwide viewing time.
An estimated 320 million digital shoppers in China, accounting for 45% of the country’s online consumers, engage in livestream buying, making live shopping a significant market.
Live streamers have streamed for more than 250 million hours.
920 million viewers are expected for game live streaming.
20.6% of individuals prefer live streamed theater shows, while 42% favor more live sports events and music concerts.
More than 50% of viewers will exit a live stream within 90 seconds if its quality is poor.
23.8% of internet users state their primary reason for utilizing social media is to view live streams.
Boomers and Gen Xers prefer watching more broadcast TV, while Gen Z and Millennials are more into streaming.
41% of individuals who stream games or social activities live are females.
Over 1.1 billion hours of streams were watched by people on YouTube Gaming.
YouTube Live TV boasts over 4 million subscribers.

8% of marketers utilize YouTube Live for their marketing efforts.
21% of individuals discover new products through live video on social media.
76% of the market share for hours watched on streaming platforms is held by Twitch, more than YouTube and Facebook.
On Twitch, there was an average of 2.7 million concurrent viewers watching streams.
Between the ages of 18 and 34, 55% of Twitch users fall.
The United States holds the largest share of Twitch traffic, with 33.2 million users.
Over 12 million hours were live streamed on Facebook Live by people.
29% of Facebook users who watch live streaming sports comment on what they are watching.
20% of the users on TikTok Live are students.
During live events, Twitter experiences a 14% increase in unique visitors.
Conclusion
We hope you enjoyed this list of streaming statistics.
We have also compiled the list of following statistics that might be useful for you to explore:
We frequently regularly update this list of statistics. Don’t hesitate to revisit this page later to find the latest data points.
Now I’d like to hear from you:
Which stat from this list surprised you the most? Or have a question?
Either way, please jump in and leave a comment below.
Leave a Reply